We just updated HedgeAware for the latest data reported by E&Ps for Q1 2018. This piece summarizes the more notable trends and observations on E&P hedging strategies and performance.
- The majority of current oil hedging positions held by US E&Ps have largely been carried over from several quarters ago. Weighted average prices for both fixed price swaps and collar ceilings are stuck in the $50/b range, diminishing the benefits of rising oil prices.
- Outstanding swap and collar positions are on pace to cost the 25 E&Ps covered in this report roughly $1.5 billion in Q2 2018, a figure approaching the group’s aggregate negative free cash flow of -$2.1 billion in Q1 2018.
- Midland-Cushing differentials have blown out to well past $10 barrel. Permian producers have significantly increased their Midland-Cushing basis swap positions with sub-3$/b discounts, but much production remains exposed to wellhead discounts.
Hedging: Present and Future
Shale-focused E&Ps bolstered their oil hedging positions over the course of Q1 2018, leaving the 25 companies[1] covered in this report more aggressively hedged as a share their production going into Q2 2018 than at any point since HedgeAware’s coverage began in Q1 2016[2]. Although strongly hedged, E&Ps are now paying a severe price.
The price of West Texas Intermediate (WTI) has risen sharply to over $70/b as of May 17, 2018 from $45/b last June. Although E&Ps have, broadly speaking, made minor adjustments to their hedging positions over the past quarter, they have seen oil prices surge well above swap prices and collar ceilings. Underwater positions are beginning to take their toll on revenues and, for most Permian companies, will offset benefits accrued from increased Midland-Cushing basis hedging.
Figure 1. Share of Oil Production Hedged Over Time
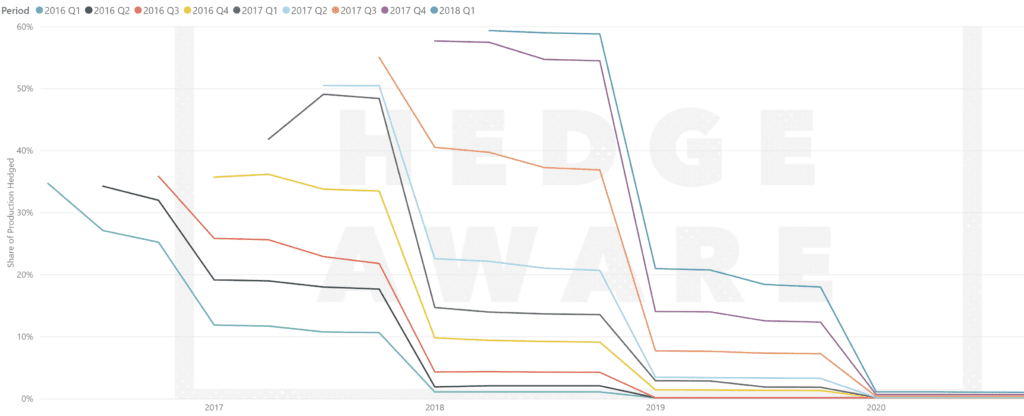
Source: HedgeAware. Includes swaps, collars, and option positions. Some hedging positions, particularly options, may be out of the money and not currently impacting realized prices.
The chart below shows the impact of hedging on realized oil prices on a per barrel basis (note that not all 25 companies report this data). For the past two quarters, each of the companies who provide this data have reported a negative impact on realized prices. The impact has become more severe as oil prices have risen and positions have not been adjusted to the new price environment.
Figure 2. Impact of Hedging on Realized Oil Prices
Source: HedgeAware
The picture does not improve much in Q2 2018 and beyond. The 25 E&Ps, whose oil production totaled 2.9 Mbd (million barrels per day) in Q1 2018, have 810 kbd (thousand barrels per day) in fixed price swaps for Q2 at a weighted average price of $55.62/b. Average swap prices remain below $60/b into the foreseeable future.
Meanwhile, collar ceilings were breached last quarter and remain a liability. The 640 kbd of collar positions held by the 25 producers have a weighted average ceiling of $58.70/b. The good news is that those ceilings do move higher in the future, but not until Q1 2019. These positions are little changed compared to the end of Q4 2017. Entering Q1 2018, the 25 companies had 760 kbd of swaps at $55.19/b and 725 kbd of collars with a weighted average ceiling of $59.22. Figure 3 below shows swaps and collar positions at the end of Q1 2018, for the second quarter and beyond.
Figure 3. Swap and Collar Positions for Q2 2018 and Beyond
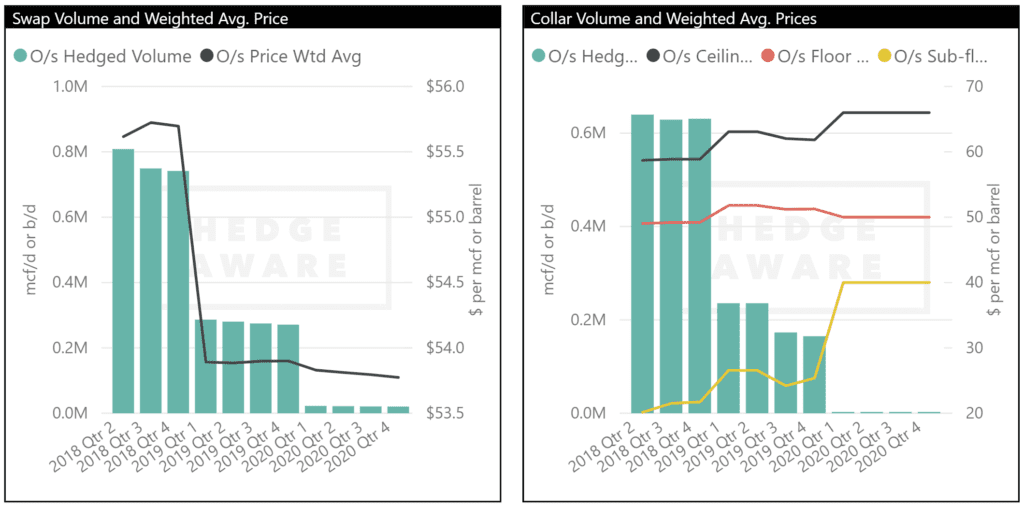
Source: HedgeAware
Revenue Impact
Back of the envelope math demonstrates that these hedging positions are likely to make a significant dent in E&P profitability. We’ll use free cash flow for context.
Figure 4 shows free cash flow by quarter for the 25 producers. Aggregate free cash flow in Q2 2018 has improved for the second consecutive quarter and is at its highest (least negative) level since Q3 2016, although would still be considered by many a poor result at -$2.1 billion. For many E&Ps, the gains from higher commodity prices are being offset by hedges that are now underwater, with most of the gains going to the counterparties.
Figure 4. Free Cash Flow by Company and Period
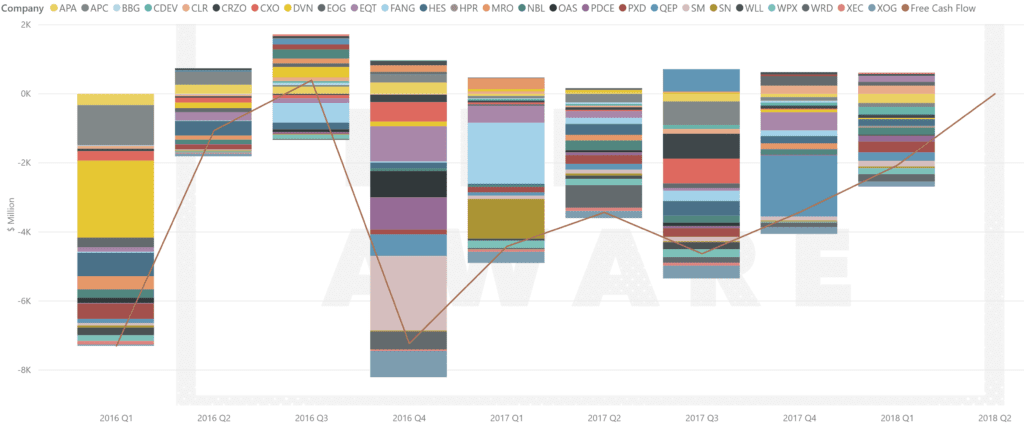
Source: HedgeAware, data is as reported via Morningstar.
If it is assumed that WTI oil prices average $70/b for Q2, we can assemble a simple forecast of the impact of current hedging positions on revenue. The 810 kbd of swaps at discount of $14.48/b to WTI will reduce sales revenue for the group of 25 by approximately $1.07 billion in Q2. The collar ceilings will eat an additional $658 million, bringing the total loss on swaps and collars to an estimated $1.73 billion in Q2. This figure represents 82% of last quarter’s free cash flow deficit or 6.4% of last quarter’s $26.98 billion of revenue.
To be fair, these 25 companies have overwhelmingly benefited from hedging going back to Q1 2016 and would do so again should oil prices correct into the low $50/b range. And for many companies, hedges are primarily a tool for creating a predictable, protected stream of cash flow around which capital budgets can be planned rather than a profit generating mechanism. Changes to positions, which can be costly, and accounting strategies will mitigate some of the impact. But in this rising price environment, with profitability taking center stage, higher commodity prices do not necessarily mean E&P profitability will benefit proportionately.
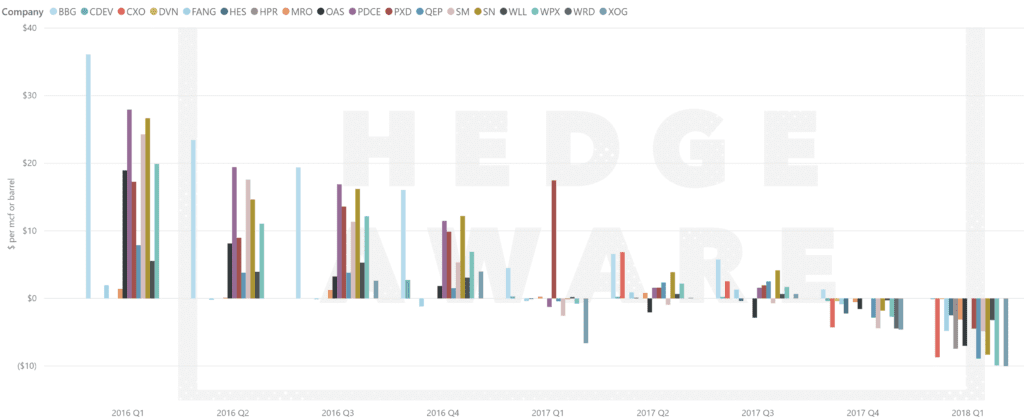
Figure 5. Distribution of Swap Positions in Effect for Q2 2018 by Company
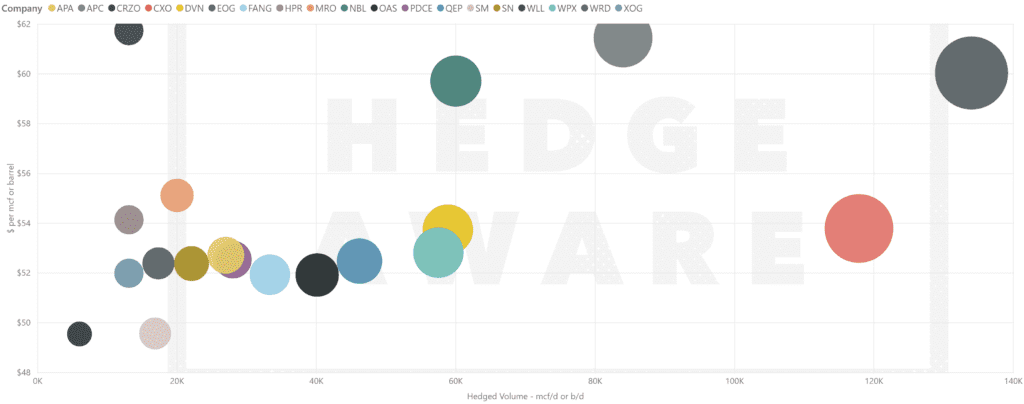
Source: HedgeAware
Basis Swap Differentials Buildup
The glut of Permian Basin oil production and lack of adequate take away capacity in the region has blown out the Midland-Cushing spread to more than $10/b in recent weeks. Producers have noted this widening differential and future uncertainty regarding the issue in their earnings calls. Some even expect the differential to move well past $20 a barrel. Producers who do not have exposure to Cushing or Gulf Coast prices are therefore selling their Permian Basin barrels at a substantial discount to WTI.
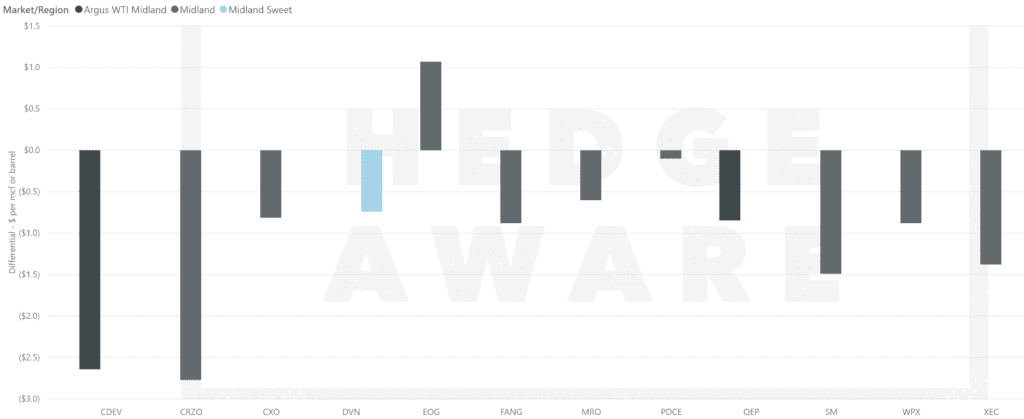
Producers have been scrambling to lock in basis differentials between WTI Midland and WTI Cushing, hoping to protect themselves from a further widening of the spread. At the end of Q1 2017, the 25 E&Ps in the HedgeAware database included in this summary had less than 100 kbd in Midland-Cushing related basis differentials in place for Q2 2017. Fast forward one year and they have secured nearly 300 kbd in basis swaps for Q2 2018 at discounts of less the $3/b. For Permian focused producers, adequate basis protection, given an uncertain future for Midland differentials, could be worth millions of dollars per quarter. CXO, DVN, and SM have the largest differential positions in Q2, as shown in the chart below.
Overall, these basis swaps represent only a modest portion of the group’s Permian production volumes. Diamondback (FANG), for example, a pure Permian Basin producer, currently produces 76 kbd of crude but has only 15 kbd hedged with basis swaps. The company recently announced plans for firm transportation agreements to take crude to the Gulf Coast in the future. But for the time being, the bulk of their barrels are exposed to spot pricing in the Midland Basin.
Figure 6. Midland-Cushing Basis Swaps and Prices by Company
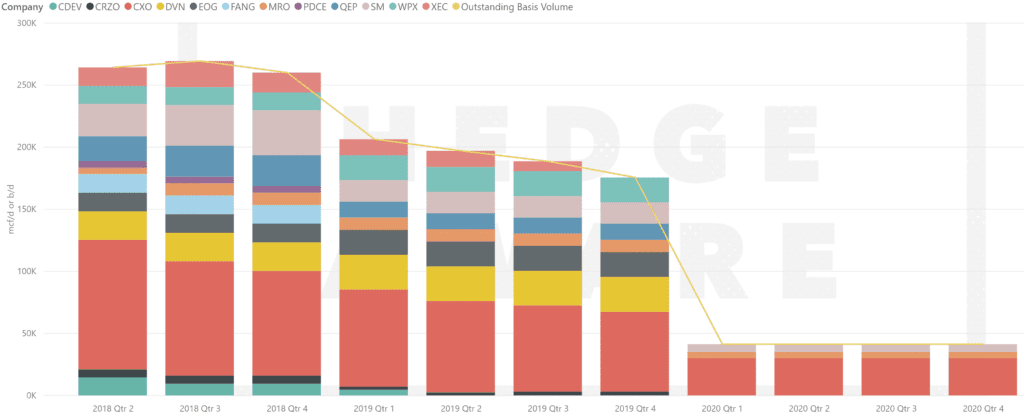
Source: HedgeAware
Midland represents the bulk of basis swaps for these 25 companies, but they also hold significant WCS and LLS/Gulf Coast swaps, depicted below.
Figure 7. All Basis Differential Positions by Type
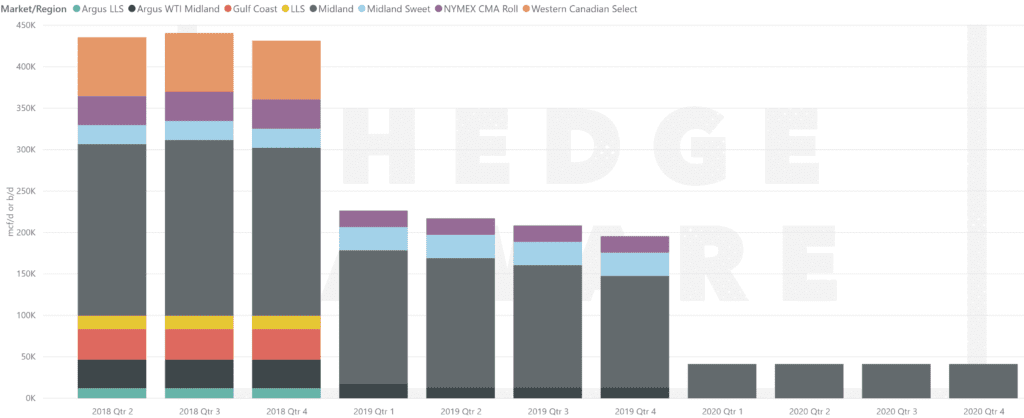
Source: HedgeAware
About HedgeAware
HedgeAware is an interactive platform that makes it easy for analysts, portfolio managers, lenders, executives and others to quickly assess E&P hedging positions in order to improve hedging strategies or determine what they mean for future financial or operational performance. It combines hedging data, performance indicators, and basis differential positions with key pricing, production, and financial metrics in a power and flexible analytical platform.
Send us a note at or call us at 970-329-1645 to setup a demonstration.
About PetroNerds
PetroNerds, LLC is a boutique energy analytics and advising firm based in Denver, CO. It provides a variety of products and services to help its clients better understand US energy markets, evaluate the performance and assets of US tight oil and gas producers, improve midstream and downstream market knowledge, and provide domestic and global policy context to ongoing events in the both US and abroad.
[1] The 25 companies are APA (Apache), APC (Anadarko), CDEV (Centennial), CLR (Continental), CRZO (Carrizo), CXO (Concho), DVN (Devon), EOG (EOG), EQT (EQT), FANG (Diamondback), HES (Hess), HPR (High Point), MRO (Marathon), NBL (Noble), OAS (Oasis), PDCE (PDC), PXD (Pioneer), QEP (QEP), SM (SM), SN (Sanchez), WLL (Whiting), WPX (WPX), WRD (Wildhorse), XEC (Cimarex), XOG (Extraction)
[2] When put and call option positions are included. When counting oil swaps and collars, hedging for the prompt quarter as a share of production declined from 51% to 50% from Q4 2017 to Q1 2018.